
BeeSpatial
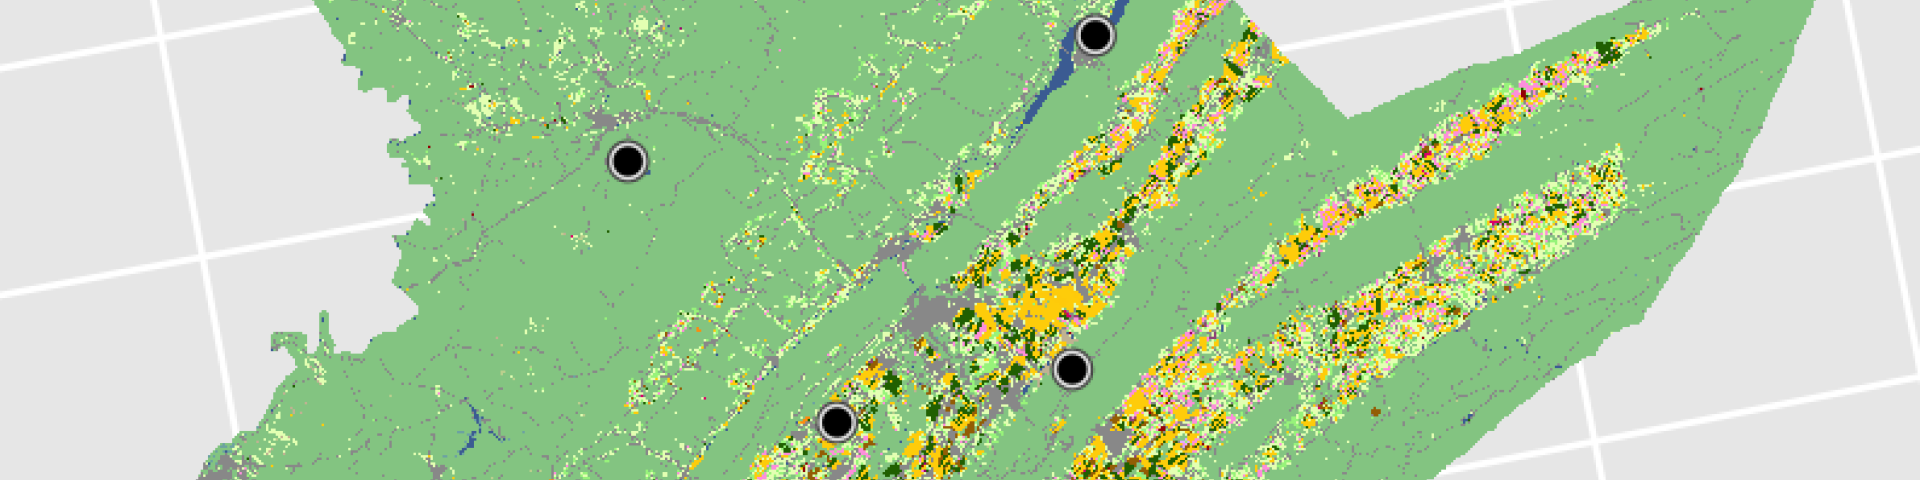
The BeeSpatial tool serves as a centralized access point for county-level precipitation, temperature and land use data across the continental United States.
How to Use BeeSpatial
CPR’s BeeSpatial (formerly BeeShiny) tutorial holds the material needed to recreate the workshop introducing BeeSpatial, which was held at Penn State's EcoSpatial Summit on Oct. 10-11, 2024. BeeSpatial is a web-based tool that makes it easier to access the land use, habitat quality, weather and climate data currently featured in Beescape, another tool developed by Penn State University. Beescape can be used by beekeepers, gardeners, urban planners, growers, researchers, and land managers to assess the quality of their landscapes for supporting bees and other pollinators. BeeSpatial is a researcher-focused complement to Beescape.
The workshop covered topics on how to use R to process GIS layers and tabular outputs downloaded from the app. The instructions for these tutorials can be accessed from the BeeSpatial Tutorial..


Questions? Contact:

The following reference provides a comprehensive overview of Beescape and Beespatial, and should be cited when referencing using these tools:Li, K. et al, 2026. Beescape and BeeSpatial: Making multi-scale environmental indicators of bee habitat accessible across audiences. Environmental and Sustainability Indicators, p.101381. https://doi.org/10.1016/j.indic.2026.101381
BeeShiny is made possible by a grant from the USDA AFRI Data Science for Food and Agricultural Systems program (#2021-67021-34146) to C. Grozinger, A. Robinson, V. Khanna and S. Goslee.